zabbix监控nginx服务
zabbix不仅可以监控主机,主机上的应用也是可以监控的。
首先在slave主机上编译安装nginx。
1. 安装编译nginx所需要的依赖性。
yum install cmake gcc openssl-devel prce-devel -y
2. 解压下载好的nginx源码包。
tar zxf nginx-1.21.6.tar.gz
3. 编译安装nginx。
cd nginx-1.21.6/
./configure --with-http_ssl_module --with-http_stub_status_module

make && make install
4. 做个软连接,启动nginx。
ln -s /usr/local/nginx/sbin/nginx /usr/local/bin/
nginx -t
nginx
5.查看nginx是否启动。
netstat -antlp | grep 80
tcp 0 0 0.0.0.0:80 0.0.0.0:* LISTEN 49559/nginx: master
tcp 0 0 127.0.0.1:60090 127.0.0.1:80 TIME_WAIT -
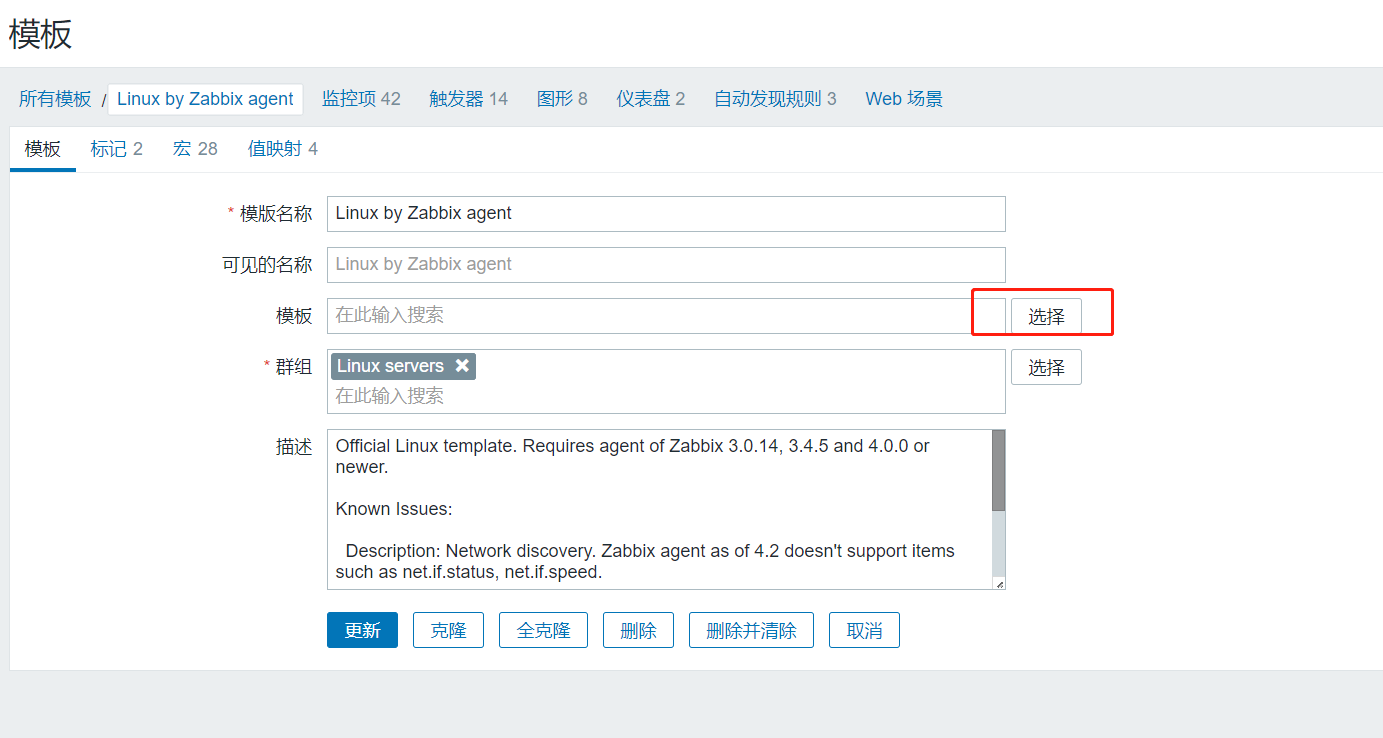
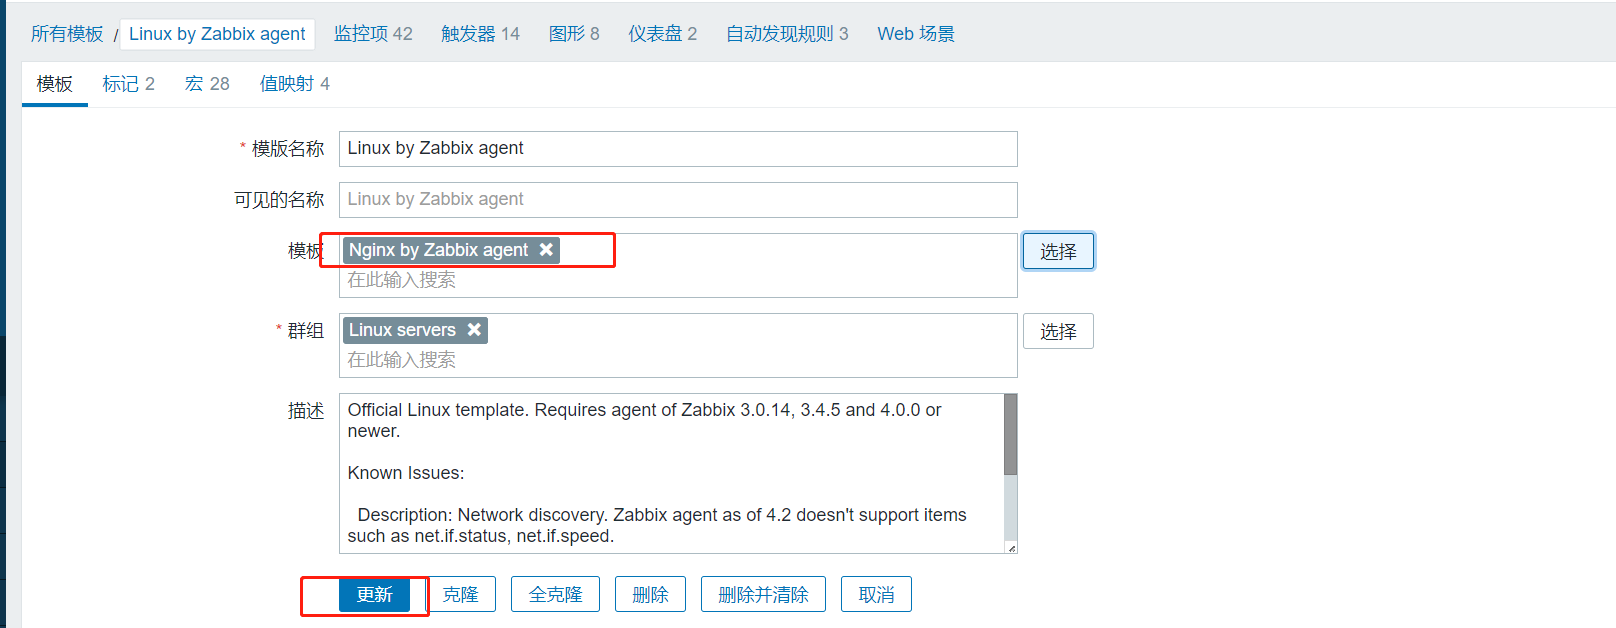
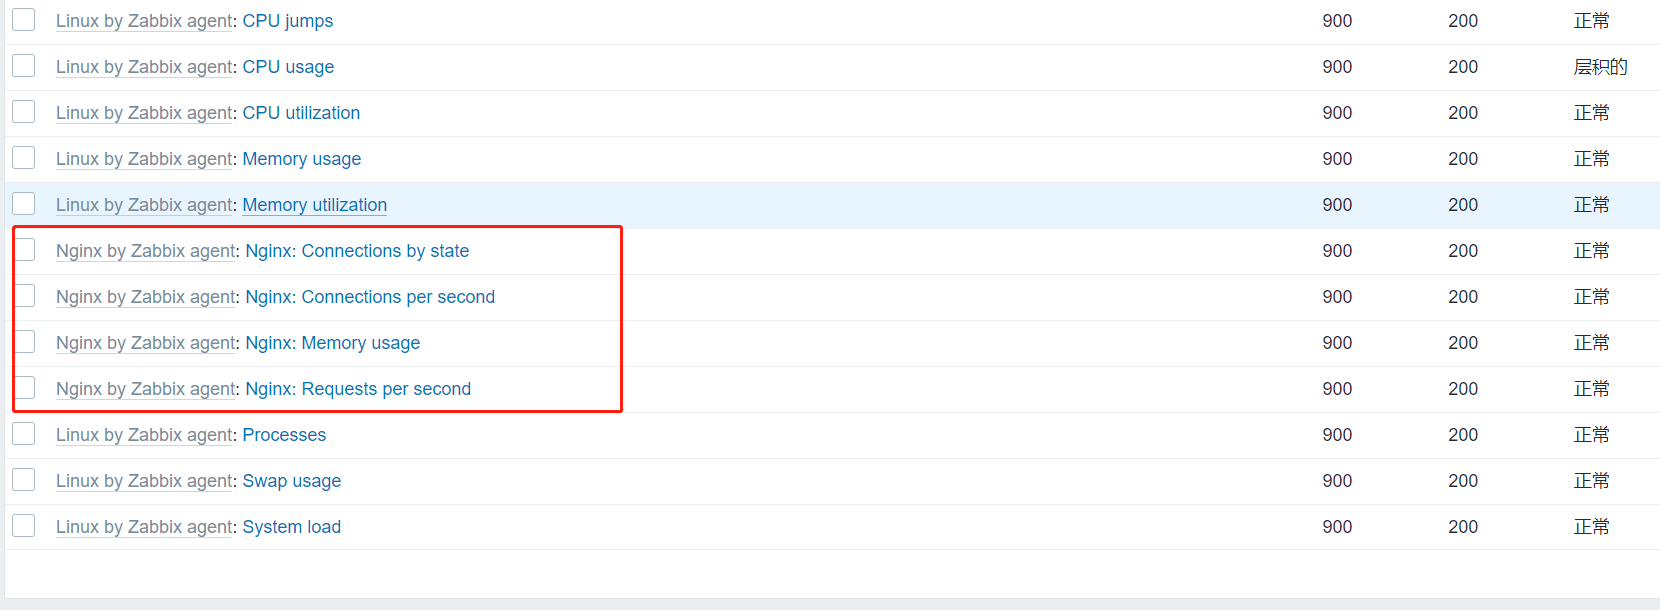
6. 在zabbix中添加监控nginx所需要的模板。

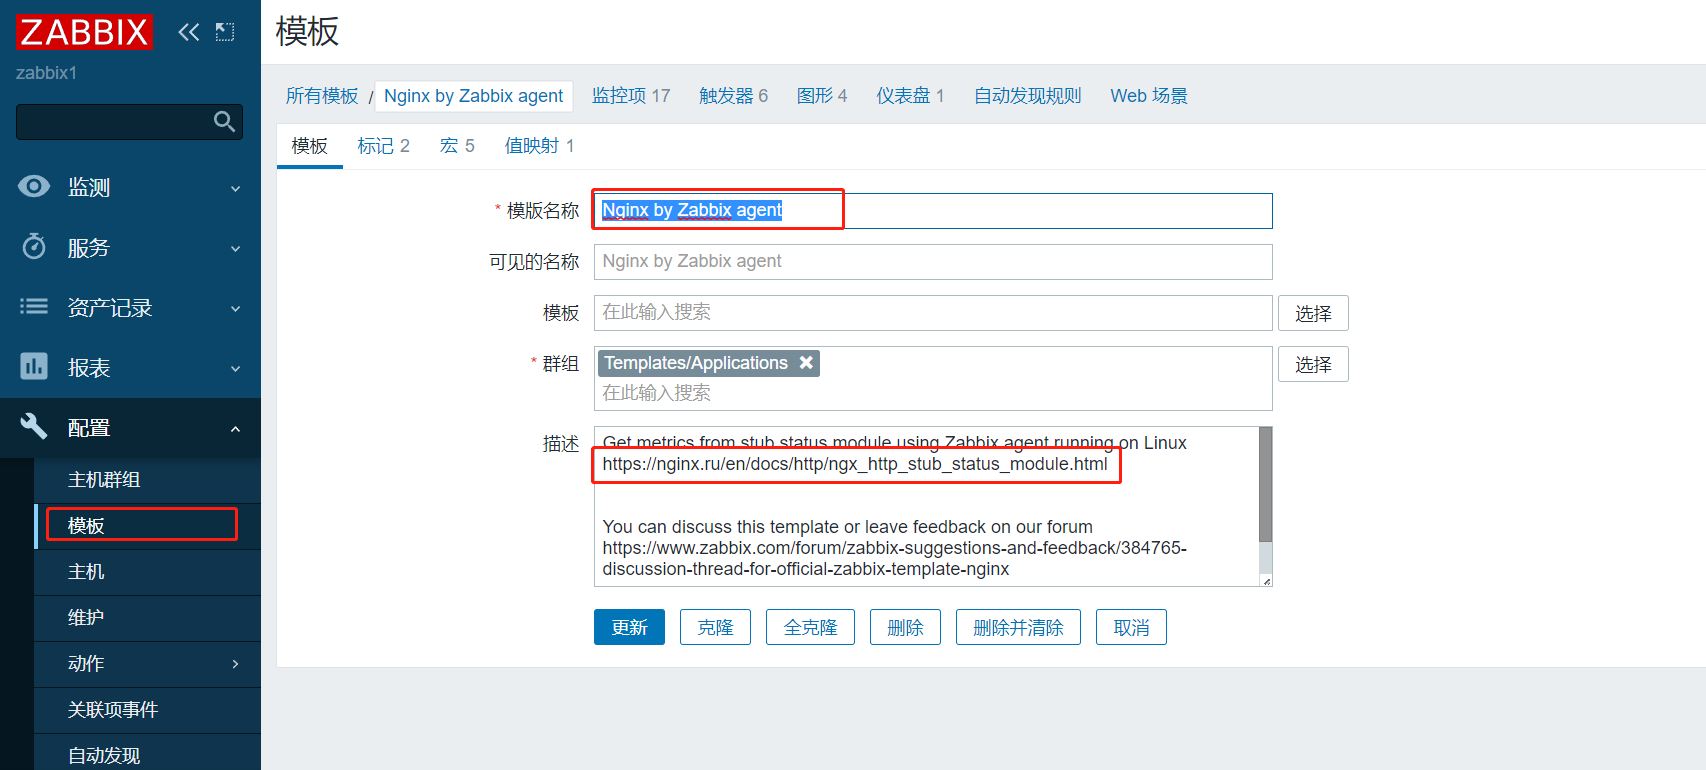
7. 在模板介绍中找到要添加在nginx配置文件中发的模块。
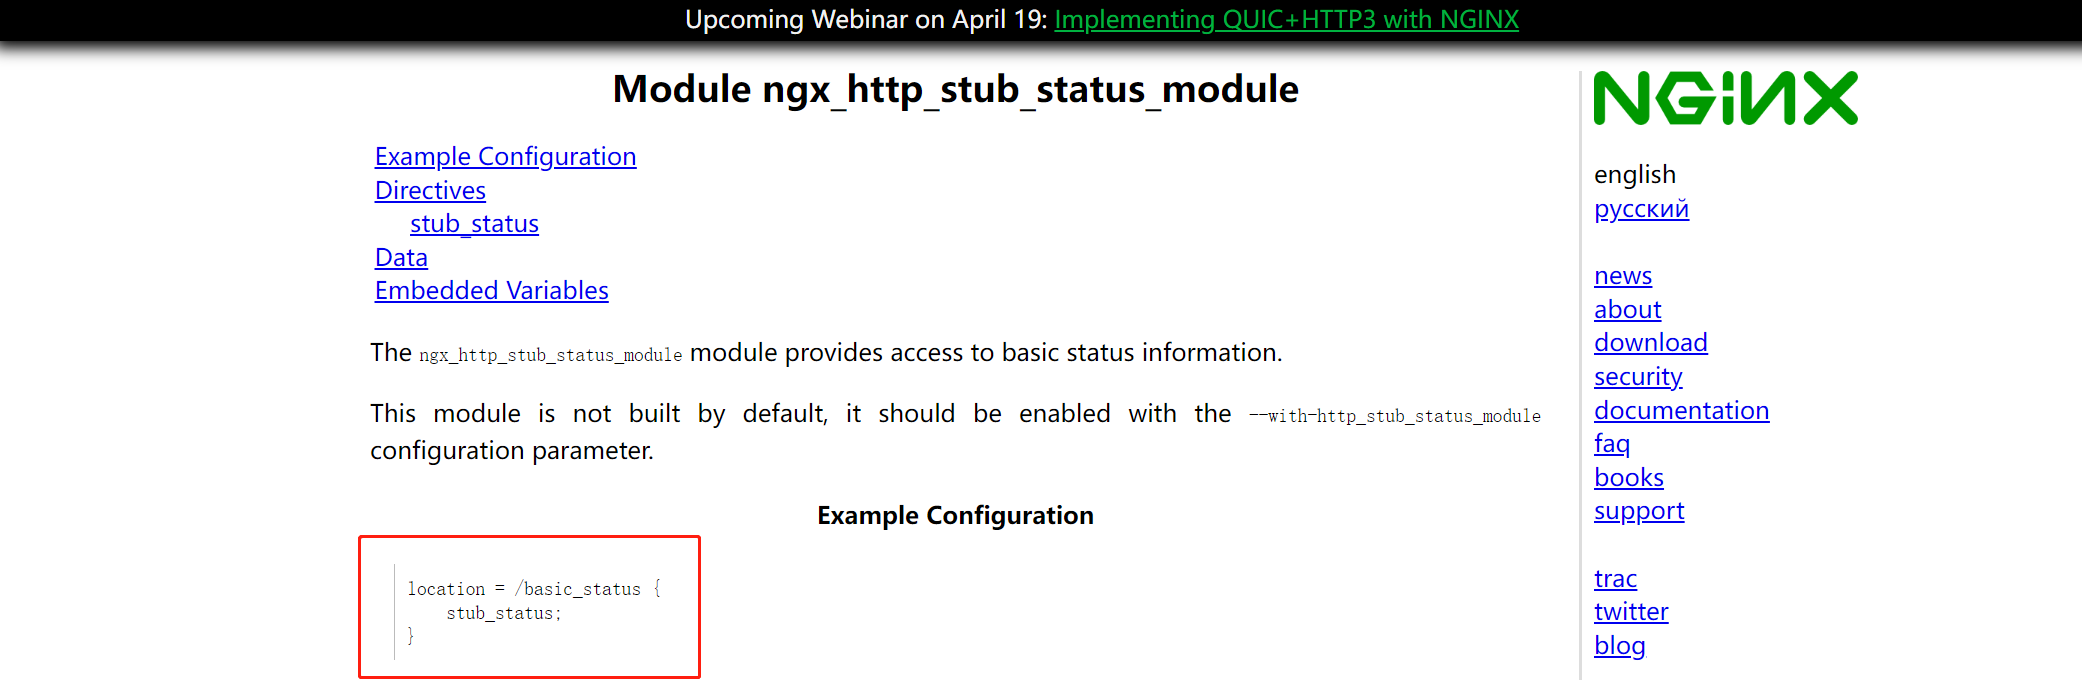
8. 编辑nginx配置文件后重新启动nginx,把上面监控模板所需要的模块添加进去。
vim /usr/local/nginx/conf/nginx.conf
57 location = /basic_status {
58 stub_status;
59 }

nginx -t
nginx -s reload
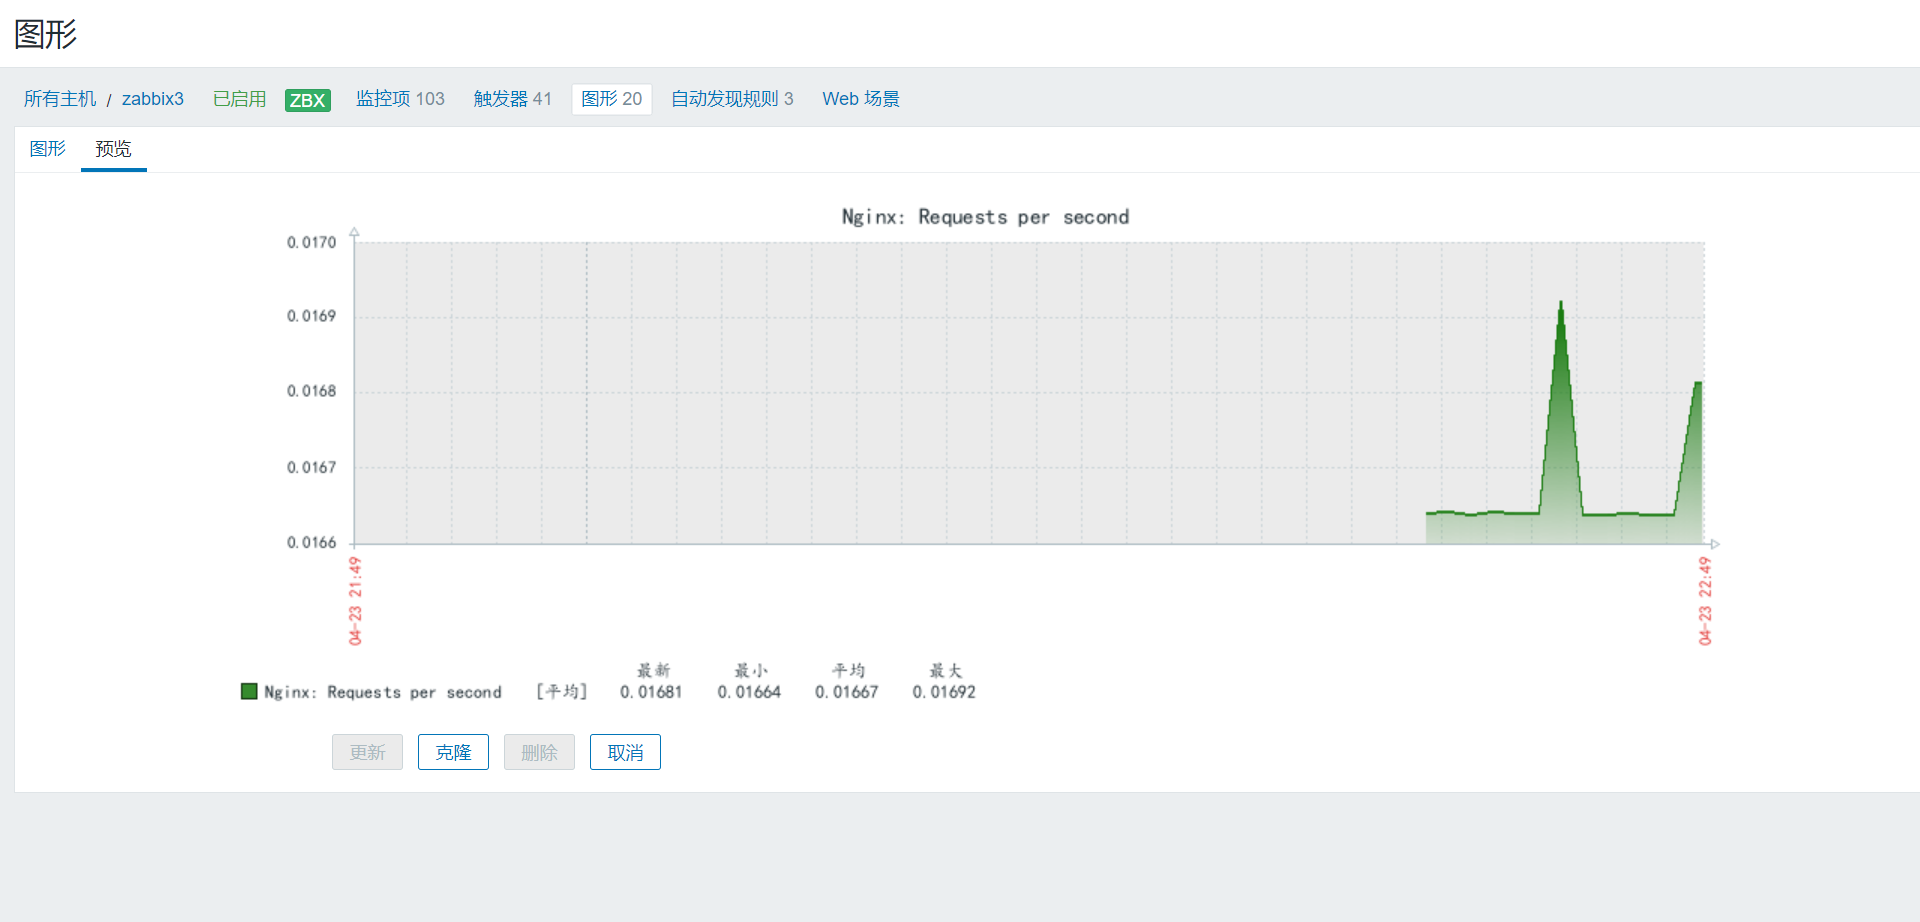
9. 在监控的图形化主机界面,查看监控的nginx图形。

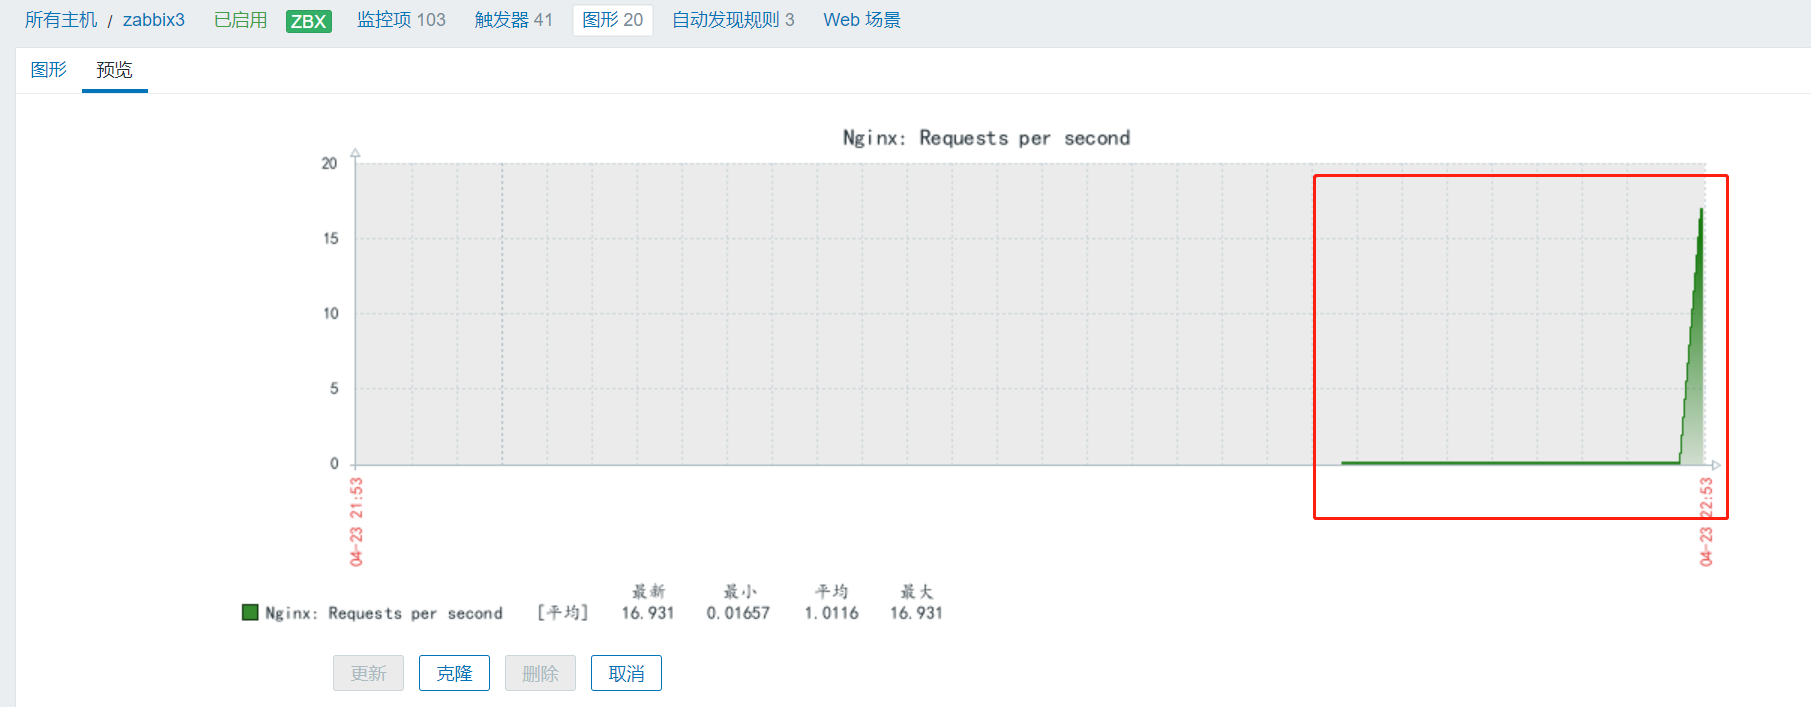
可以压测一下,查看监控的nginx情况
[root@zabbix1 fonts]# ab -c 5 -n 1000 http://192.168.2.30/index.html
This is ApacheBench, Version 2.3 <$Revision: 1843412 $>
Copyright 1996 Adam Twiss, Zeus Technology Ltd, http://www.zeustech.net/
Licensed to The Apache Software Foundation, http://www.apache.org/

Benchmarking 192.168.2.30 (be patient)
Completed 100 requests
Completed 200 requests
Completed 300 requests
Completed 400 requests
Completed 500 requests
Completed 600 requests
Completed 700 requests
Completed 800 requests
Completed 900 requests
Completed 1000 requests
Finished 1000 requests


Server Software: nginx/1.21.6
Server Hostname: 192.168.2.30
Server Port: 80

Document Path: /index.html
Document Length: 615 bytes

Concurrency Level: 5
Time taken for tests: 0.151 seconds
Complete requests: 1000
Failed requests: 0
Total transferred: 848000 bytes
HTML transferred: 615000 bytes
Requests per second: 6606.50 [#/sec] (mean)
Time per request: 0.757 [ms] (mean)
Time per request: 0.151 [ms] (mean, across all concurrent requests)
Transfer rate: 5471.01 [Kbytes/sec] received

Connection Times (ms)
min mean[+/-sd] median max
Connect: 0 0 0.1 0 1
Processing: 0 0 0.2 0 2
Waiting: 0 0 0.1 0 1
Total: 0 1 0.2 1 2

Percentage of the requests served within a certain time (ms)
50% 1
66% 1
75% 1
80% 1
90% 1
95% 1
98% 1
99% 1
100% 2 (longest request)
在监控中查看的nginx情况