
Prometheus对Node Exporter,MySQLD Exporter进行监控
安装Prometheus Server
Prometheus基于Golang编写,编译后的软件包,不依赖于任何的第三方依赖。用户只需要下载对应平台的二进制包,解压并且添加基本的配置即可正常启动Prometheus Server。
从二进制包安装
对于非Docker用户,可以从https://prometheus.io/download/找到最新版本的Prometheus Sevrer软件包:
[root@server ~]# wget https://github.com/prometheus/prometheus/releases/download/v2.27.1/prometheus-2.27.1.linux-amd64.tar.gz
解压下载的prometheus-2.27.1.linux-amd64.tar.gz安装包:
[root@server ~]#  tar -xf prometheus-2.17.1.linux-amd64.tar.gz -C /usr/local/

解压后当前目录会包含默认的Prometheus配置文件promethes.yml:

[root@server ~]#  cd /usr/local/

[root@server ~]# mv prometheus-2.17.1.linux-amd64 prometheus

[root@server ~]# cd prometheus

[root@server ~]# cp prometheus.yml prometheus.yml.bak

console_libraries consoles LICENSE NOTICE prometheus prometheus.yml prometheus.yml.bak promtool

[root@server ~]# cat prometheus.yml

# my global config
global:
  scrape_interval:     15s # Set the scrape interval to every 15 seconds. Default is every 1 minute.
  evaluation_interval: 15s # Evaluate rules every 15 seconds. The default is every 1 minute.
  # scrape_timeout is set to the global default (10s).

# Alertmanager configuration
alerting:
  alertmanagers:
  - static_configs:
    - targets:
      # - alertmanager:9093

# Load rules once and periodically evaluate them according to the global 'evaluation_interval'.
rule_files:
  # - "first_rules.yml"
  # - "second_rules.yml"

# A scrape configuration containing exactly one endpoint to scrape:
# Here it's Prometheus itself.
scrape_configs:
  # The job name is added as a label `job=<job_name>` to any timeseries scraped from this config.
  - job_name: 'prometheus'

    # metrics_path defaults to '/metrics'
    # scheme defaults to 'http'.

    static_configs:
    - targets: ['localhost:9090']
将prometheus添加到系统服务,方便于管理,以服务方式启动
[root@server ~]# vim /usr/lib/systemd/system/prometheus.service

[Unit]
Description=https://prometheus.io/

[Service]
Restart=on-failure
ExecStart=/usr/local/prometheus/prometheus --config.file=/usr/local/prometheus/prometheus.yml

[Install]
WantedBy=multi-user.target
启动prometheus服务,设置开机自启
[root@server ~]# systemctl daemon-reload
[root@server ~]# systemctl enable --now prometheus.service
在浏览器进行访问, IP:9090

使用Node Exporter采集主机运行数据
安装Node Exporter
在Prometheus的架构设计中,Prometheus Server并不直接服务监控特定的目标,其主要任务负责数据的收集,存储并且对外提供数据查询支持。因此为了能够能够监控到某些东西,如主机的CPU使用率,我们需要使用到Exporter。Prometheus周期性的从Exporter暴露的HTTP服务地址(通常是/metrics)拉取监控样本数据。
从上面的描述中可以看出Exporter可以是一个相对开放的概念,其可以是一个独立运行的程序独立于监控目标以外,也可以是直接内置在监控目标中。只要能够向Prometheus提供标准格式的监控样本数据即可。
这里为了能够采集到主机的运行指标如CPU, 内存,磁盘等信息。我们可以使用Node Exporter。
Node Exporter同样采用Golang编写,并且不存在任何的第三方依赖,只需要下载,解压即可运行。可以从https://prometheus.io/download/获取最新的node exporter版本的二进制包。
[root@client_01 ~]# wget https://github.com/prometheus/node_exporter/releases/download/v0.18.1/node_exporter-0.18.1.linux-amd64.tar.gz
[root@client_01 ~]# tar -xzf node_exporter-0.18.1.linux-amd64.tar.gz -C /usr/local/
[root@client_01 node_exporter-0.17.0.linux-amd64 ]# cd node_exporter-0.17.0.linux-amd64/
[root@client_01 node_exporter-0.17.0.linux-amd64 ]# mv node_exporter-0.17.0.linux-amd64 node_exporter
将node_exporter添加到系统服务,方便于管理,以服务方式启动
[root@server ~]# cat /usr/lib/systemd/system/node_exporter.service

[Unit]
Description=Open node_exporter server daemon

[Service]
Restart=on-failure
ExecStart=/usr/local/node_exporter/node_exporter --collector.systemd --collector.systemd.unit-whitelist=(docker|sshd|nginx).service

[Install]
WantedBy=multi-user.target
运行node exporter
[root@client_01 ~]# systemctl enable --now node_exporter.service
启动成功后,查看端口
[root@client_01 ~]# netstat -anplt|grep 9100
tcp6 0 0 :::9100 :::* LISTEN 70819/node_exporter
tcp6 0 0 192.168.12.130:9100 192.168.12.128:45690 ESTABLISHED 70819/node_exporter
访问IP:9100可以看到以下页面:

初始Node Exporter监控指标
访问IP:9100/metrics,可以看到当前node exporter获取到的当前主机的所有监控数据,如下所示:
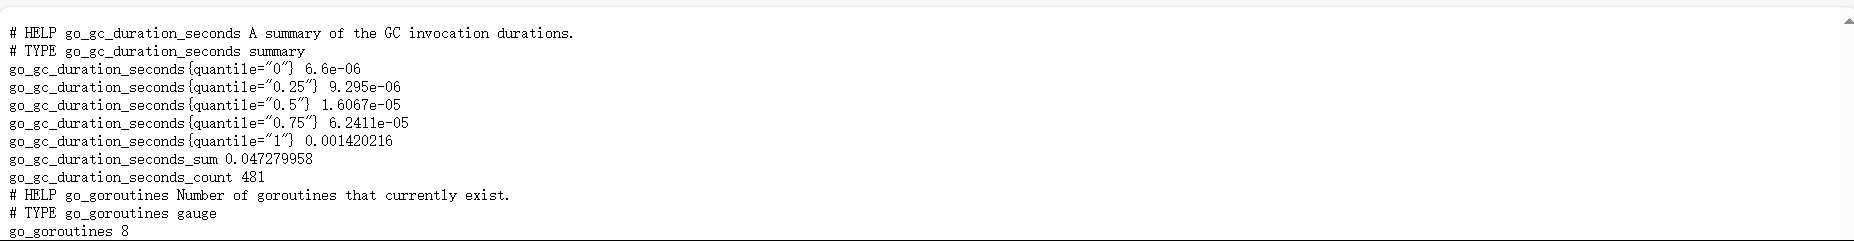
每一个监控指标之前都会有一段类似于如下形式的信息:
# HELP node_cpu_seconds_total Seconds the cpus spent in each mode.
# TYPE node_cpu_seconds_total counter
node_cpu_seconds_total{cpu="0",mode="idle"} 367499.9
node_cpu_seconds_total{cpu="0",mode="iowait"} 0.5
node_cpu_seconds_total{cpu="0",mode="irq"} 0
node_cpu_seconds_total{cpu="0",mode="nice"} 5.07
node_cpu_seconds_total{cpu="0",mode="softirq"} 5.32
其中HELP用于解释当前指标的含义,TYPE则说明当前指标的数据类型。在上面的例子中node_cpu的注释表明当前指标是cpu0上idle进程占用CPU的总时间,CPU占用时间是一个只增不减的度量指标,从类型中也可以看出node_cpu的数据类型是计数器(counter),与该指标的实际含义一致。又例如node_load1该指标反映了当前主机在最近一分钟以内的负载情况,系统的负载情况会随系统资源的使用而变化,因此node_load1反映的是当前状态,数据可能增加也可能减少,从注释中可以看出当前指标类型为仪表盘(gauge),与指标反映的实际含义一致。
除了这些以外,在当前页面中根据物理主机系统的不同,你还可能看到如下监控指标:
- node_boot_time:系统启动时间
- node_cpu:系统CPU使用量
- nodedisk*:磁盘IO
- nodefilesystem*:文件系统用量
- node_load1:系统负载
- nodememeory*:内存使用量
- nodenetwork*:网络带宽
- node_time:当前系统时间
- go_*:node exporter中go相关指标
- process_*:node exporter自身进程相关运行指标
从Node Exporter收集监控数据
为了能够让Prometheus Server能够从当前node exporter获取到监控数据,这里需要修改Prometheus配置文件。编辑prometheus.yml并在scrape_configs节点下添加以下内容:
scrape_configs:
  # The job name is added as a label `job=<job_name>` to any timeseries scraped from this config.
  - job_name: 'prometheus'

    # metrics_path defaults to '/metrics'
    # scheme defaults to 'http'.

    static_configs:
      - targets: ['localhost:9090']

  - job_name: 'client_01'
    static_configs:
      - targets: ['192.168.12.130:9100'] #node_exporter安装在本地,如安装在其他机器使用IP即可,9100是node_exporter的端口号
        labels:
          instance: node_exporter #名称自定义,最好具有代表性
          refresh_interval: 5s

  - job_name: 'server'
    static_configs:
      - targets: ['192.168.12.128:9100'] #node_exporter安装在本地,如安装在其他机器使用IP即可,9100是node_exporter的端口号
        labels:
          instance: node_exporter #名称自定义,最好具有代表性
          refresh_interval: 5s
编辑完成后检测更改后的配置文件是否有效:
[root@server ~]# cd /usr/local/prometheus/
[root@server prometheus]# ./promtool check config prometheus.yml
Checking prometheus.yml
  SUCCESS: 0 rule files found
监控MySQL运行状态:MySQLD Exporter
MySQL是一个关系型数据库管理系统,由瑞典MySQL AB公司开发,目前属于Oracle旗下的产品。 MySQL是最流行的关系型数据库管理系统之一。数据库的稳定运行是保证业务可用性的关键因素之一。这一小节当中将介绍如何使用Prometheus提供的MySQLD Exporter实现对MySQL数据库性能以及资源利用率的监控和度量。
二进制部署MySQL_Exporter
[root@client_02 ~]# wget https://github.com/prometheus/mysqld_exporter/releases/download/v0.12.1/mysqld_exporter-0.12.1.linux-amd64.tar.gz
[root@client_02 ~]# tar xvf mysqld_exporter-0.12.1.linux-amd64.tar.gz -C /usr/local/
[root@client_02 ~]# mv /usr/local/mysqld_exporter-0.12.0.linux-amd64 /usr/local/mysqld_exporter
# 创建配置文件
[root@client_02 ~]# cat > /usr/local/mysqld_exporter/.my.cnf << EFO
[client]
user=mysqld_exporter
password=12345678
EOF
# 创建systemd服务
[root@client_02 ~]# cat > /etc/systemd/system/mysql_exporter.service << EOF

[Unit]
Description=mysqld_exporter

[Service]
ExecStart=/usr/local/mysqld_exporter/mysqld_exporter --config.my-cnf /usr/local/mysqld_exporter/.my.cnf --web.listen-address=0.0.0.0:9104 \
--collect.slave_status \
--collect.binlog_size \
--collect.info_schema.processlist \
--collect.info_schema.innodb_metrics \
--collect.engine_innodb_status \
--collect.perf_schema.file_events \
--collect.perf_schema.replication_group_member_stats
Restart=on-failure

[Install]
WantedBy=multi-user.target
EOF
向数据库授予权限 grant permission to database.
[root@client_02 ~]# mysql -uroot -p
Enter password:
Welcome to the MySQL monitor. Commands end with ; or \g.
Your MySQL connection id is 3319
Server version: 8.1.0 MySQL Community Server - GPL

Copyright (c) 2000, 2023, Oracle and/or its affiliates.

Oracle is a registered trademark of Oracle Corporation and/or its
affiliates. Other names may be trademarks of their respective
owners.

Type 'help;' or '\h' for help. Type '\c' to clear the current input statement.

mysql> GRANT REPLICATION CLIENT, PROCESS ON *.* TO 'mysqld_exporter'@'localhost' identified by '12345678';
mysql> GRANT SELECT ON performance_schema.* TO 'mysqld_exporter'@'localhost';
mysql> flush privileges;
mysql> ^DBye
运行mysql_exporter.service
[root@client_01 ~]# systemctl enable --now mysql_exporter.service
启动成功后,查看端口
[root@client_02 ~]# netstat -anplt | grep 9104
tcp6 0 0 :::9104 :::* LISTEN 70665/mysqld_export
tcp6 0 0 192.168.12.131:9104 192.168.12.128:33210 ESTABLISHED 70665/mysqld_export
访问IP:9100可以看到以下页面:
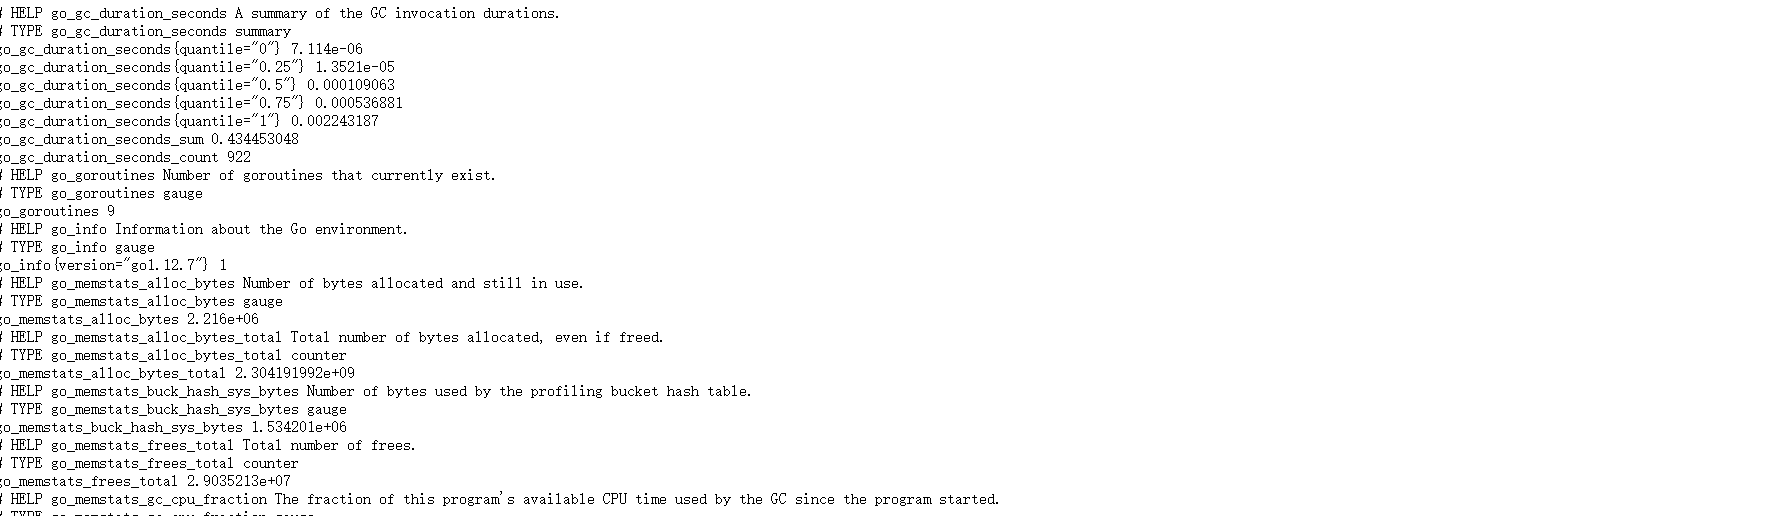
初始MySQLD Exporter监控指标
访问IP:9100/metrics,可以看到当前node exporter获取到的当前主机的所有监控数据,如下所示:
为了能够让Prometheus Server能够从当前 mysqld_export 获取到监控数据,这里需要修改Prometheus配置文件。编辑prometheus.yml并在scrape_configs节点下添加以下内容:
 - job_name: 'client_02'
   static_configs: #静态发现
     - targets: ['192.168.12.131:9104']
       labels:
         instance: mysqld-exporter
编辑完成后检测更改后的配置文件是否有效:
[root@server ~]# cd /usr/local/prometheus/
[root@server prometheus]# ./promtool check config prometheus.yml
Checking prometheus.yml
  SUCCESS: 0 rule files found
重新启动Prometheus Server
[root@server ~]# systemctl restart prometheus.service
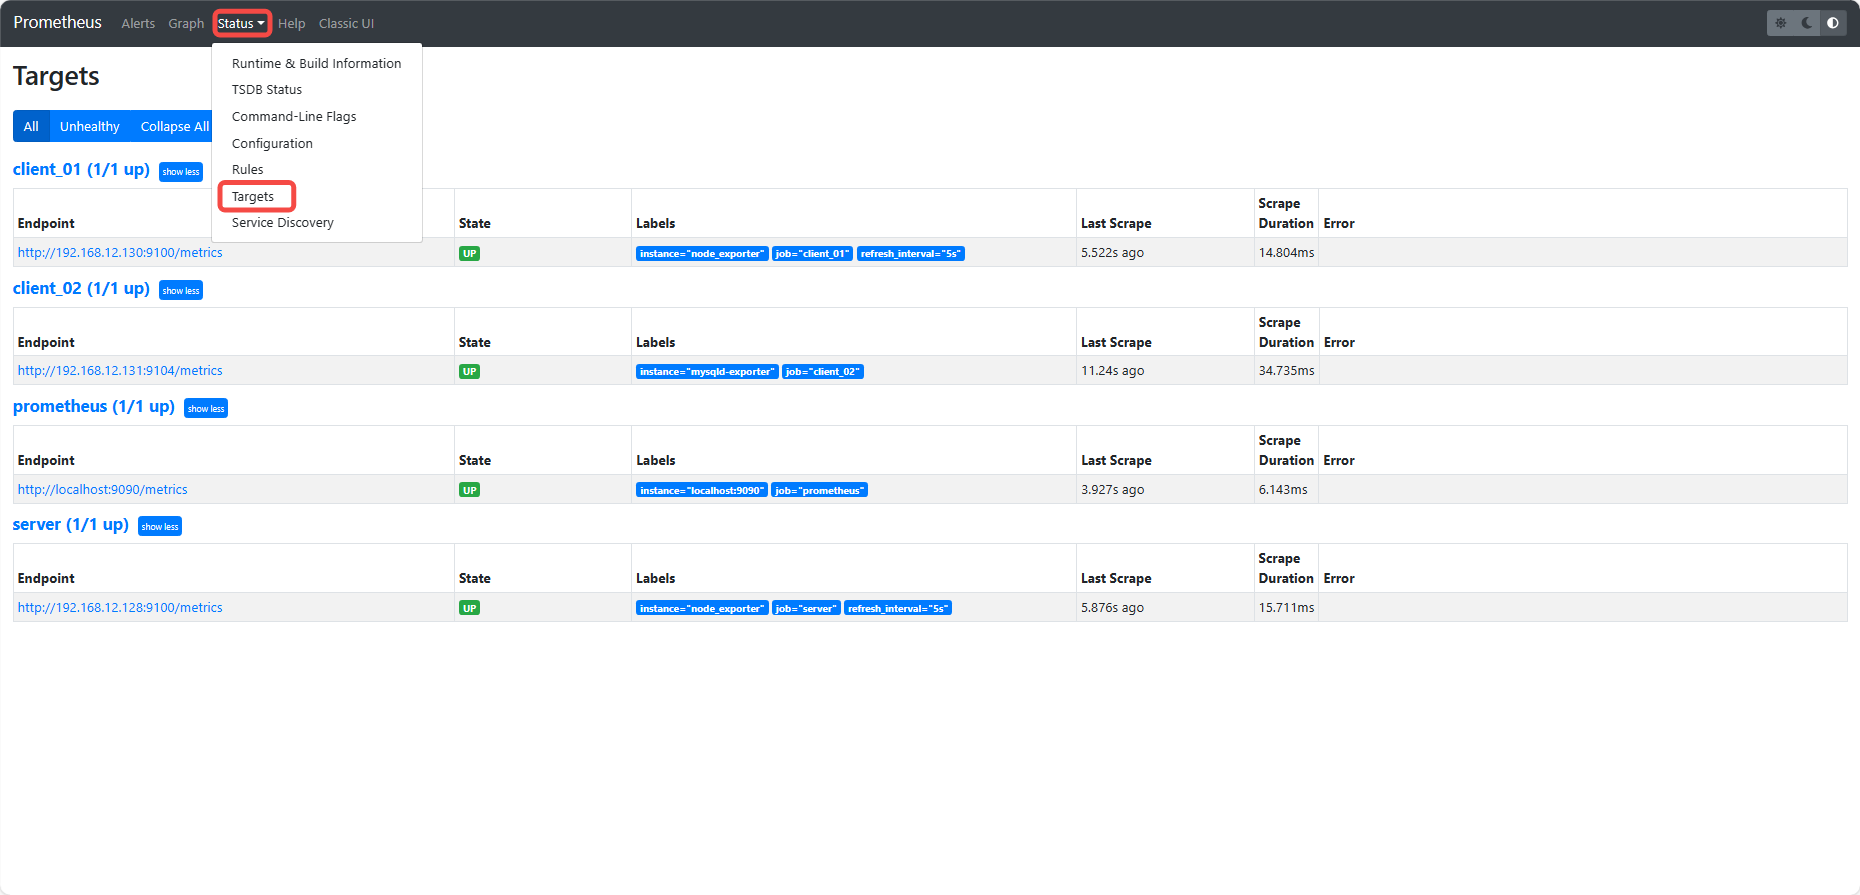
访问 IP:9090 , 进入到Prometheus Server,点击Status选择Targets即可看到监控的服务端主机添加的服务。
如果输入“up”并且点击执行按钮以后,可以看到如下结果: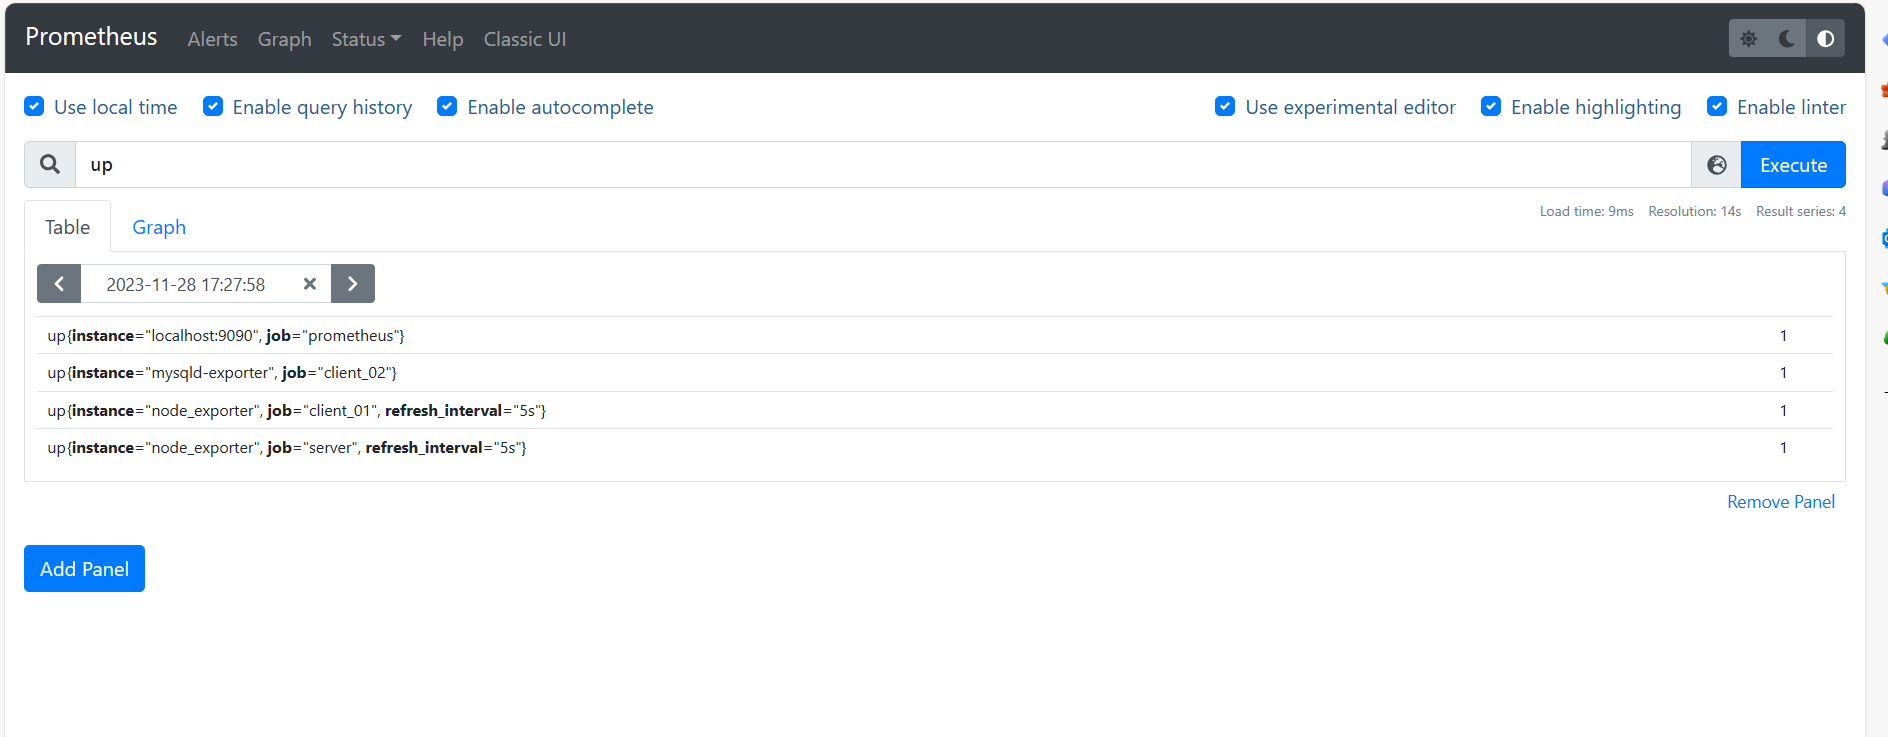
如果Prometheus能够正常从node exporter,mysqld exporter获取数据,则会看到以下结果:
其中“1”表示正常,反之“0”则为异常。
|
up{instance=“localhost:9090”, job=“prometheus”}
|
1 |
|
up{instance=“mysqld-exporter”, job=“client_02”}
|
1 |
|
up{instance=“node_exporter”, job=“client_01”, refresh_interval=“5s”}
|
1 |
|
up{instance=“node_exporter”, job=“server”, refresh_interval=“5s”}
|
1 |
Prometheus UI是Prometheus内置的一个可视化管理界面,通过Prometheus UI用户能够轻松的了解Prometheus当前的配置,监控任务运行状态等。 通过
面板,用户还能直接使用
实时查询监控数据:

切换到
面板,用户可以使用PromQL表达式查询特定监控指标的监控数据。如下所示,查询主机负载变化情况,可以使用关键字
可以查询出Prometheus采集到的主机负载的样本数据,这些样本数据按照时间先后顺序展示,形成了主机负载随时间变化的趋势图表:


现在都这么高端了吗
恭喜发现宝藏网站👽